Access data of more than 1.5 million orders during Flipkart Big Billion Day (BBD) & Amazon Great Indian Festival. Put on your analytic hat and analyze key customer attributes such as Average selling price, Discount percentage, COD percentage, and more across different regions & categories.
The first leg of the most awaited Flipkart Big Billion Day (BBD) & Amazon Great Indian Festival sale got over on October 10, 2021. Analyzing the fashion and apparel sales data of more than 1.5 Million orders processed during the sale by our WMS, we noticed:
The overall revenue contribution of the top 20 cities this year was higher as compared to last year. This year shoppers bought products at a higher ASP and at a lower discount percentage across categories.
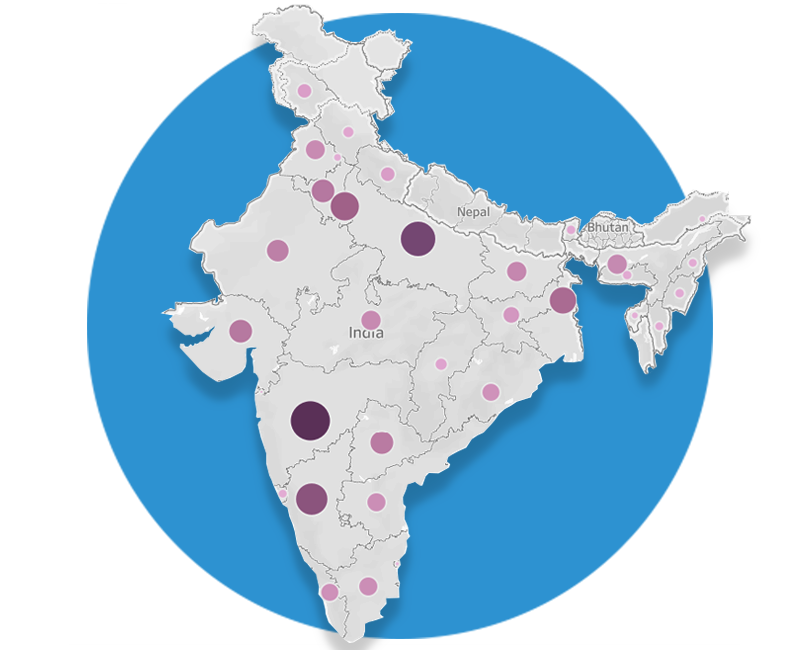
East India’s revenue contribution was more than West. The North Eastern states emerged as a high potential market which contributed to 7% of the national revenue. A higher than average COD percentage indicated the need for improvement in logistics and faster order fulfilment with distributed warehousing.
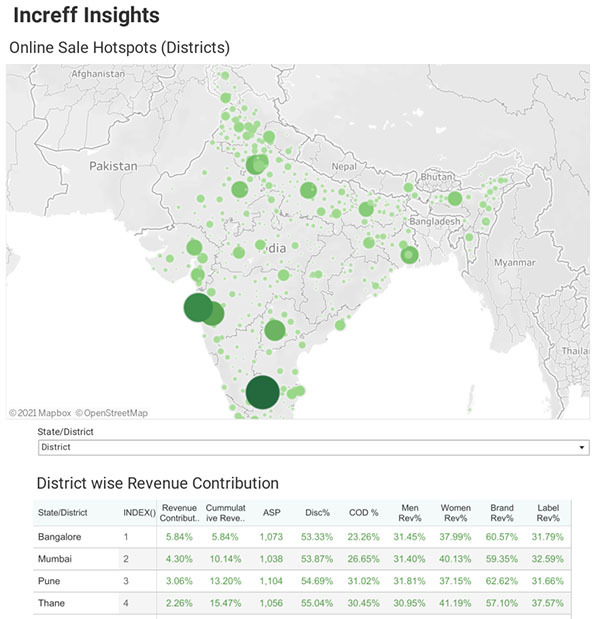
Tech cities (Bangalore, Pune & Hyderabad) contributed to 12.6% of the national revenue, however, their spending pattern was surprisingly different than expected.
Track pants contributed nearly the same revenue as jeans and were sold at a higher ASP reflecting the shift in consumer behaviour due to work from home scenario.
Increff management has a wonderful combination of rich merchandising experience and cutting edge technology, one of the biggest challenges for fashion retailers has been continuously improving first quality sell-through, which Increff has really been helpful by improving the relevant merchandise available on the floor.